


NVIDIA (NVDA) Technical Analysis: The Importance of the 200-Day Moving Average
It's do or die...

NVIDIA (NVDA) has been a dominant player in the semiconductor industry, with strong momentum in both AI and gaming sectors. Given its volatility and strong growth trajectory, traders and investors closely monitor technical indicators to gauge potential entry and exit points. Among these, the 200-day moving average (200-DMA) stands out as a crucial level for determining NVDA’s long-term trend strength.
In this post, we’ll analyze NVDA using technical indicators, with a particular focus on the 200-day moving average and why it plays a significant role in decision-making.
Understanding the 200-Day Moving Average
The 200-day moving average is a widely followed technical indicator that helps traders and investors identify the overall trend of a stock. It represents the average closing price over the past 200 trading days and acts as a key support or resistance level in different market conditions.
When NVDA’s price trades above the 200-DMA, it signals a long-term uptrend.
When NVDA’s price falls below the 200-DMA, it may indicate weakness and a potential shift to a bearish trend.
The 200-DMA acts as dynamic support in bullish trends, where the price often finds buying interest at this level.
Conversely, it serves as resistance in downtrends, where failed attempts to break above it confirm bearish sentiment.
Recent NVDA Technical Analysis
1. Current Trend & 200-DMA Analysis
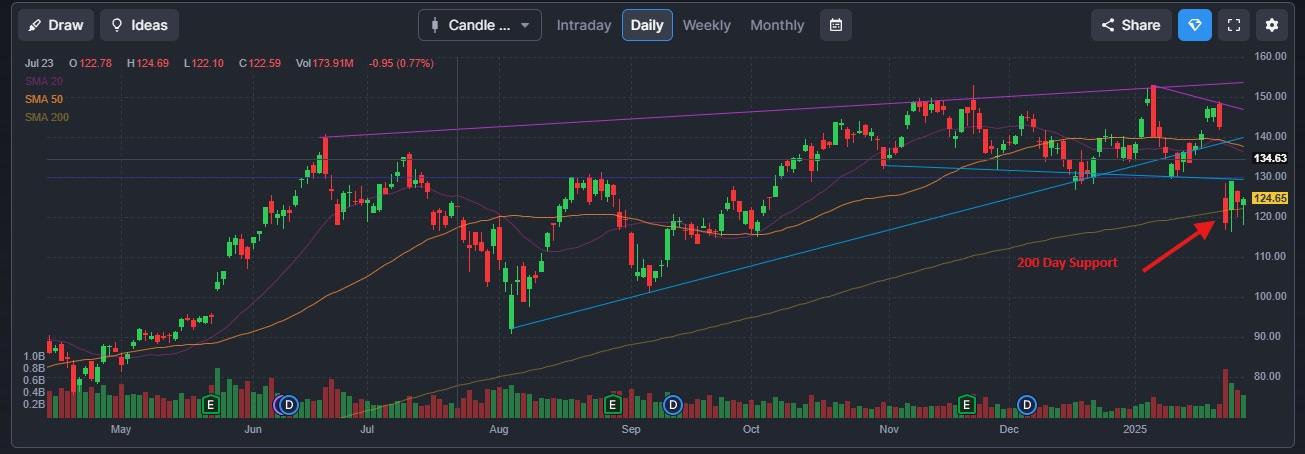
NVDA has been trading in a strong uptrend, frequently testing and respecting the 200-day moving average as support. In previous corrections, the stock found stability around this level before resuming its uptrend.
Bullish Scenario: If NVDA stays above the 200-DMA, it suggests strong institutional buying and confidence in the stock’s long-term growth.
Bearish Scenario: A sustained break below the 200-DMA could trigger further downside, attracting selling pressure as traders interpret it as a sign of trend reversal.
2. Key Support and Resistance Levels
Support: The 200-DMA currently serves as a critical support level. If NVDA bounces off this level, it may confirm a buying opportunity.
Resistance: If the stock rallies, the previous high or trendline resistance could be key areas to watch for potential pullbacks.
3. Additional Technical Indicators
Relative Strength Index (RSI): If RSI is above 50 and NVDA holds the 200-DMA, it suggests bullish momentum.
MACD (Moving Average Convergence Divergence): A bullish MACD crossover above the signal line while trading above the 200-DMA strengthens the case for continued upside.
Volume Analysis: Higher volume near the 200-DMA can indicate strong institutional interest, reinforcing the level as key support.
Conclusion: Why the 200-DMA Matters for NVDA Investors
For both traders and long-term investors, the 200-day moving average is a crucial reference point in NVDA’s price action. Whether acting as support during bullish trends or resistance in bear markets, this level helps define market sentiment and potential reversals.
Actionable Insights:
If NVDA stays above the 200-DMA, it presents a strong bullish case with potential for higher highs.
If NVDA breaks below the 200-DMA, cautious trading is advised, as it may indicate trend weakening or potential downside.
By integrating the 200-DMA with other technical indicators, traders can make informed decisions to optimize their NVDA trading strategies. Keep an eye on price action around this level to identify key opportunities in the stock’s movement.
If you found this helpful please share with at least 1 person!!!